19. Text: Recap
Recap
In this lesson, you got a glimpse at the ways that we can measure how well our models are performing.
Training & Testing Data
First, it is important to always split your data into training and testing. Then you will measure how well your model performs on the test set of data after being fit training data.
Classification Measures
If you are fitting your model to predict categorical data (spam not spam), there are different measures to understand how well your model is performing than if you are predicting numeric values (the price of a home).
As we look at classification metrics, note that the wikipedia page on this topic is wonderful, but also a bit daunting. I frequently use it to remember which metric does what.
Specifically, you saw how to calculate:
- Accuracy
Accuracy is often used to compare models, as it tells us the proportion of observations we correctly labeled.
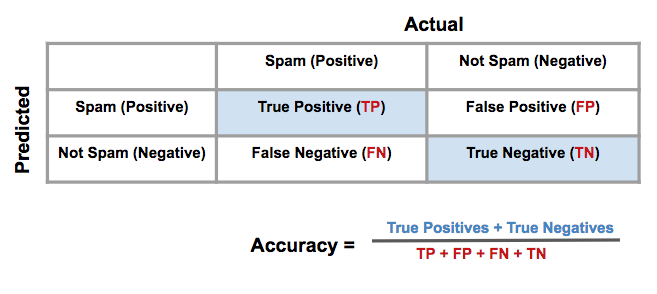
Often accuracy is not the only metric you should be optimizing on. This is especially the case when you have class imbalance in your data. Optimizing on only accuracy can be misleading in how well your model is truly performing. With that in mind, you saw some additional metrics.
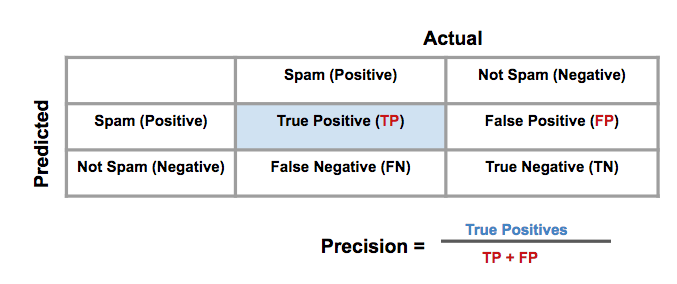
- Precision
Precision focuses on the predicted "positive" values in your dataset. By optimizing based on precision values, you are determining if you are doing a good job of predicting the positive values, as compared to predicting negative values as positive.
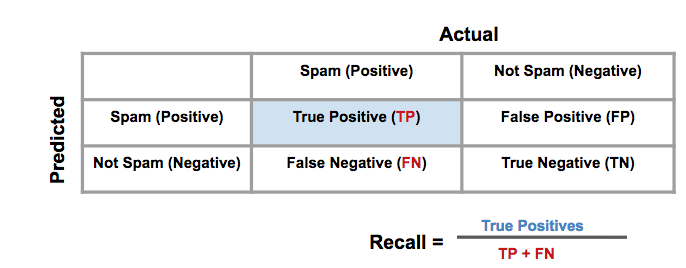
- Recall
Recall focuses on the actual "positive" values in your dataset. By optimizing based on recall values, you are determining if you are doing a good job of predicting the positive values without regard of how you are doing on the actual negative values. If you want to perform something similar to recall on the actual 'negative' values, this is called specificity (TN / (TN + FP)).
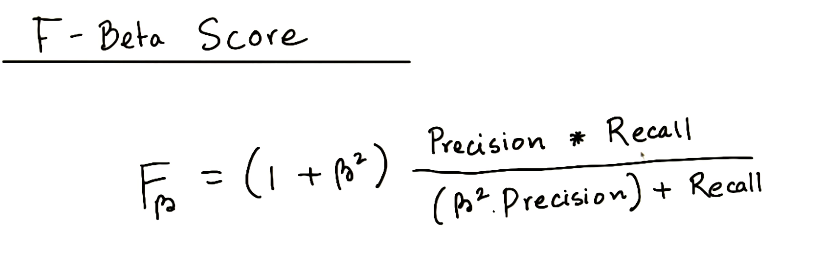
- F-Beta Score
In order to look at a combination of metrics at the same time, there are some common techniques like the F-Beta Score (where the F1 score is frequently used), as well as the ROC and AUC. You can see that the \beta parameter controls the degree to which precision is weighed into the F score, which allows precision and recall to be considered simultaneously. The most common value for beta is 1, as this is where you are finding the harmonic average between precision and recall.
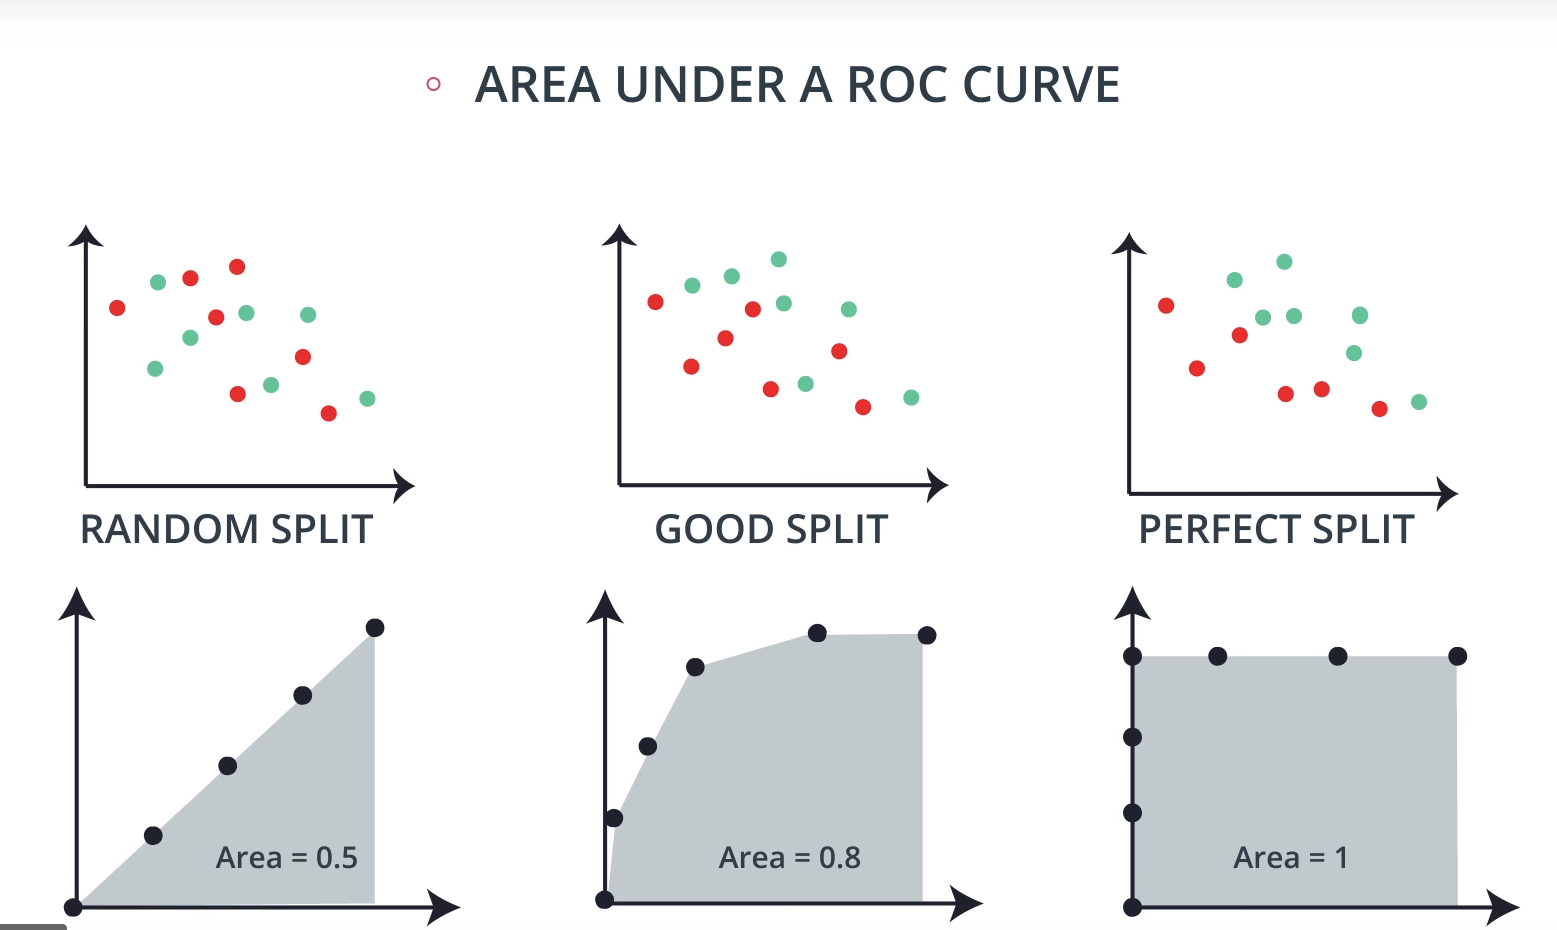
- ROC Curve & AUC
By finding different thresholds for our classification metrics, we can measure the area under the curve (where the curve is known as a ROC curve). Similar to each of the other metrics above, when the AUC is higher (closer to 1), this suggests that our model performance is better than when our metric is close to 0.
You may end up choosing to optimize on any of these measures. I commonly end up using AUC or an F1 score in practice. However, there are always reason to choose one measure over another depending on your situation.
Regression Measures
You want to measure how well your algorithms are performing on predicting numeric values? In these cases, there are three main metrics that are frequently used. mean absolute error, mean squared error, and r2 values.
As an important note, optimizing on the mean absolute error may lead to a different 'best model' than if you optimize on the mean squared error. However, optimizing on the mean squared error will always lead to the same 'best' model as if you were to optimize on the r2 value.
Again, if you choose a model with the best r2 value (the highest), it will also be the model that has the lowest (MSE). Choosing one versus another is based on which one you feel most comfortable explaining to someone else.
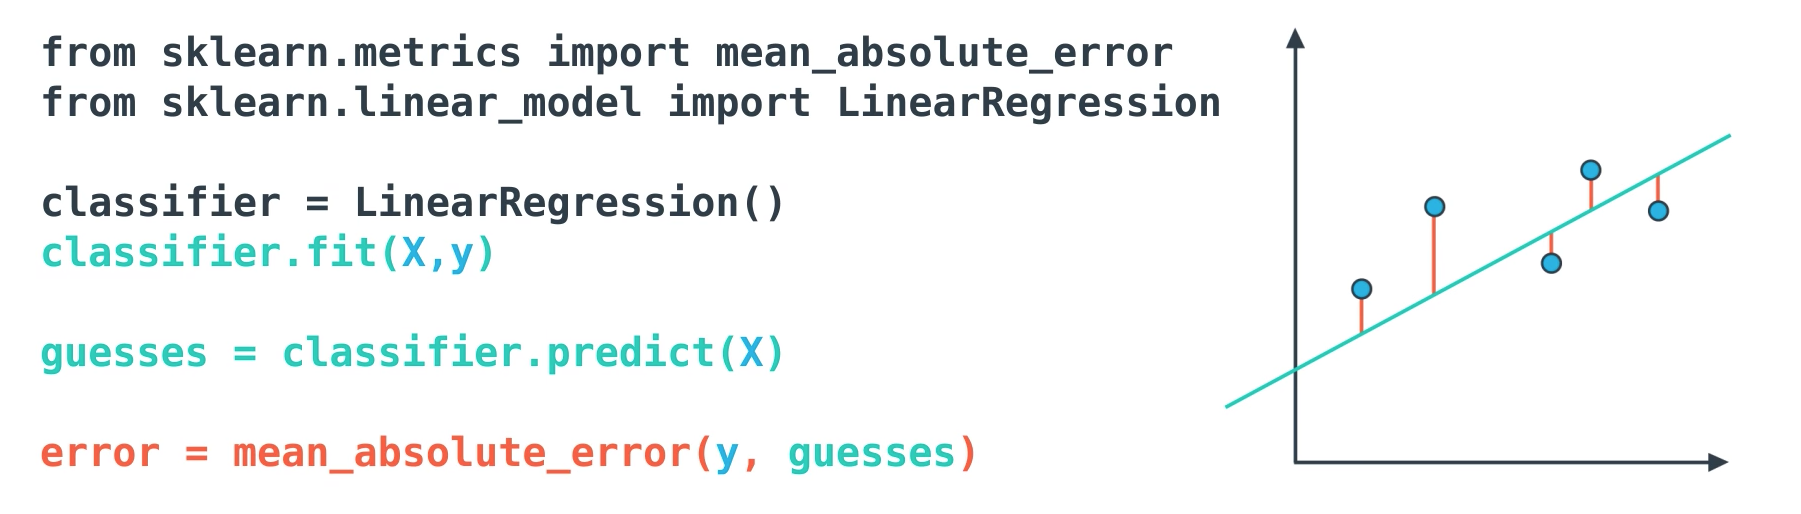
- Mean Absolute Error (MAE)
The first metric you saw was the mean absolute error. This is a useful metric to optimize on when the value you are trying to predict follows a skewed distribution. Optimizing on an absolute value is particularly helpful in these cases because outliers will not influence models attempting to optimize on this metric as much as if you use the mean squared error. The optimal value for this technique is the median value. When you optimize for the R2 value of the mean squared error, the optimal value is actually the mean.
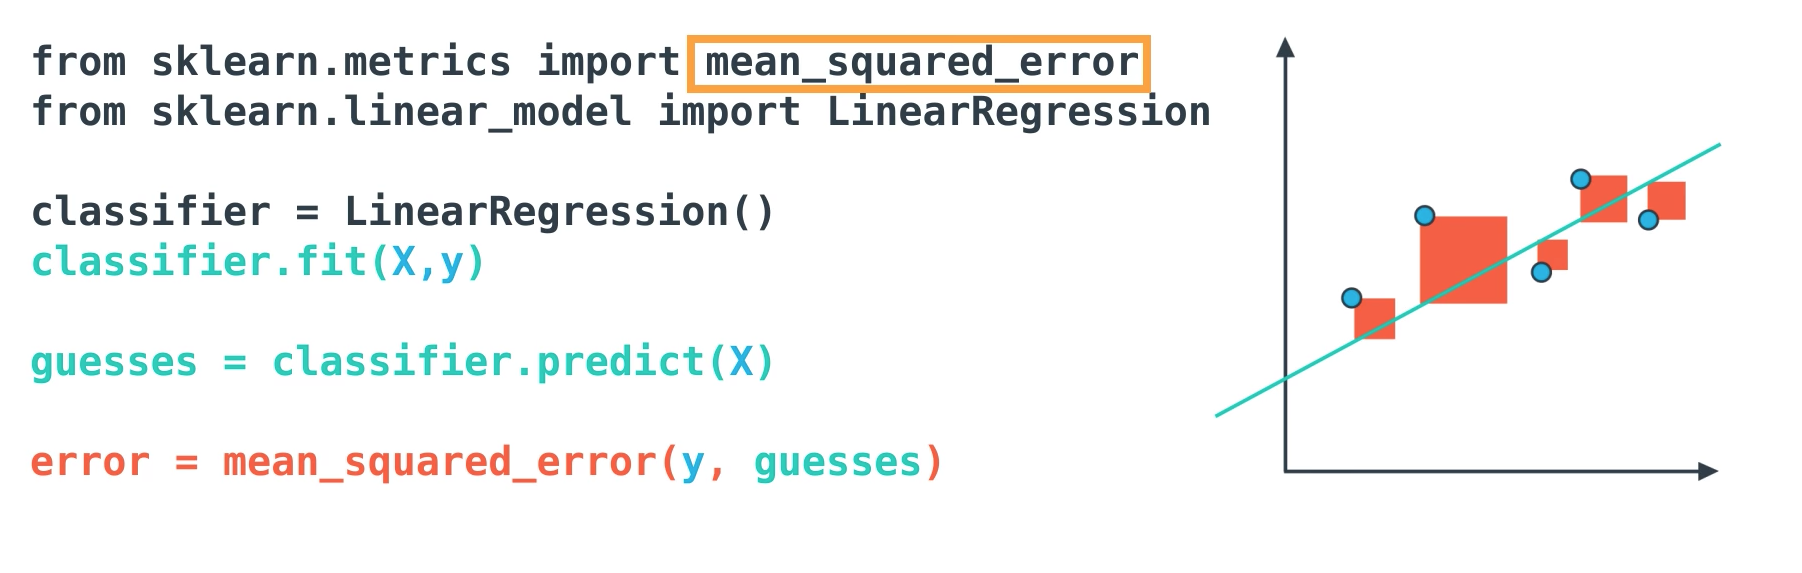
- Mean-Squared Error (MSE)
The mean squared error is by far the most used metric for optimization in regression problems. Similar to with MAE, you want to find a model that minimizes this value. This metric can be greatly impacted by skewed distributions and outliers. When a model is considered optimal via MAE, but not for MSE, it is useful to keep this in mind. In many cases, it is easier to actually optimize on MSE, as the a quadratic term is differentiable. However, an absolute value is not differentiable. This factor makes this metric better for gradient based optimization algorithms.
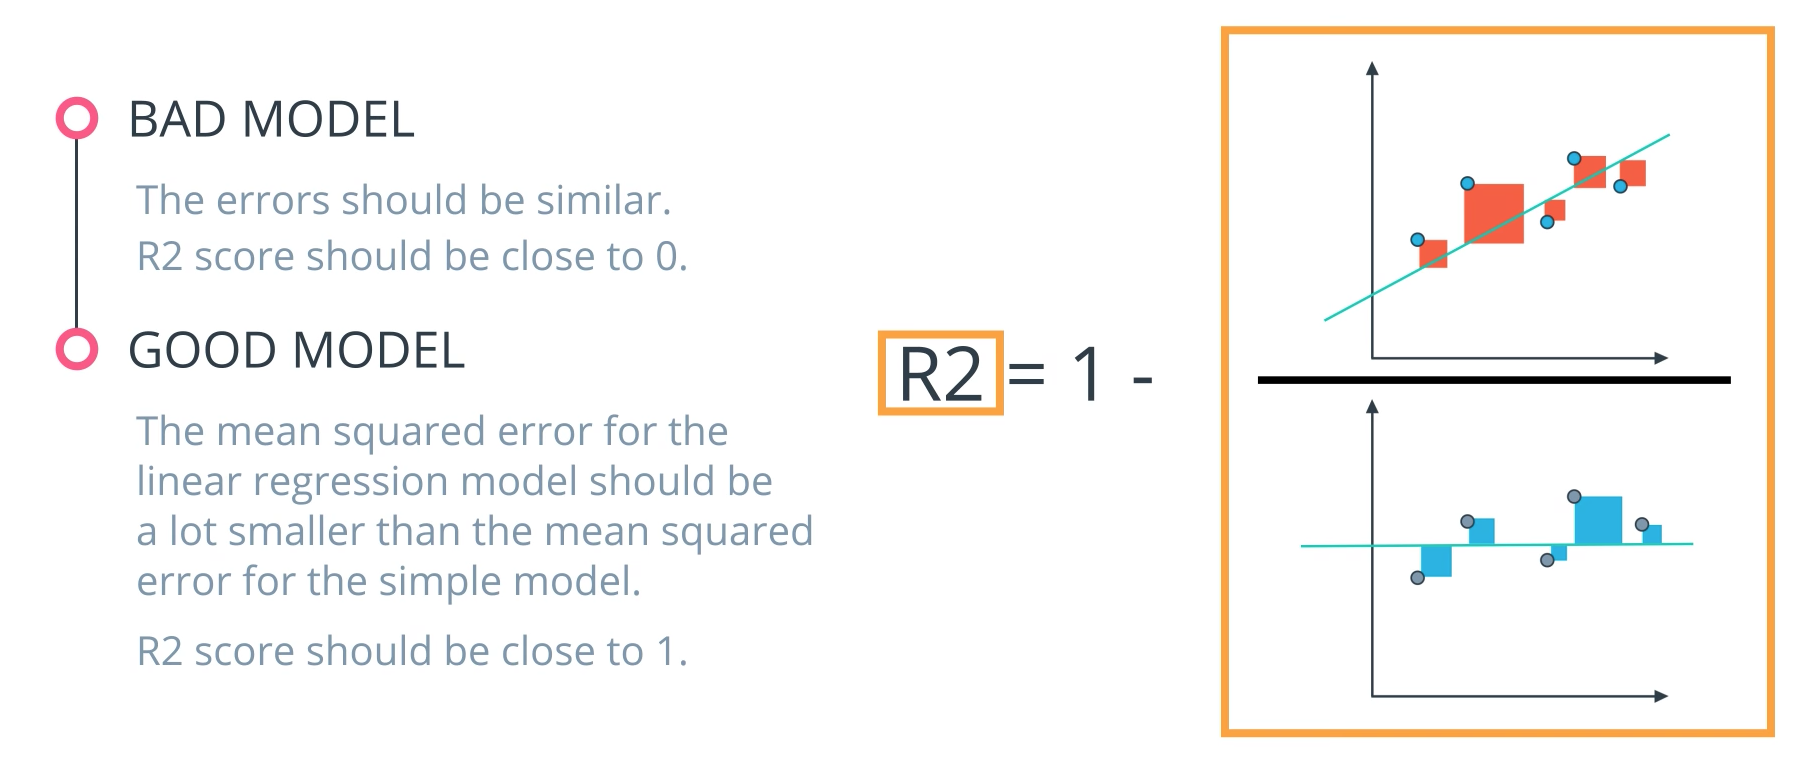
- R2 Score
Finally, the r2 value is another common metric when looking at regression values. Optimizing a model to have the lowest MSE will also optimize a model to have the the highest R2 value. This is a convenient feature of this metric. The R2 value is frequently interpreted as the 'amount of variability' captured by a model. Therefore, you can think of MSE, as the average amount you miss by across all the points, and the R2 value as the amount of the variability in the points that you capture with a model.
Closing Words
This ends this lesson on metrics. In the final lesson before the project, you will get some practice tuning and optimizing your models.